Topic
This article describes the status page for Open Mesh Switches.
Environment
- Open Mesh Switches
Description
CloudTrax has a Status page for each switch in your network that provides a graphical overview of a switch's ports, traffic utilization, PoE utilization, and more.
Procedure
Navigation
1. Navigate to Manage ? Switches and select a switch.
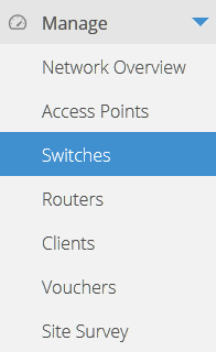 Figure 1: Switches
2. Click your desired switch.
Graphical Information
The following information is available about your switch in the status page:
Name and Description
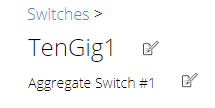 Figure 2: Name and Description
Shows the current name and description for your switch. Click on the ????symbol to enter a new name or description.
Switch Ports
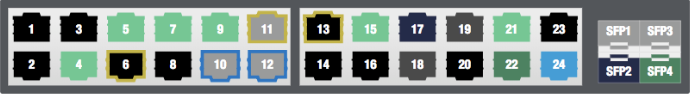
Figure 3: A switch with connected ports
The top of the Status page will show a graphic of your switch, with all available ports. Each port is color-coded:
- Black: The port has no active connection. PoE and link are both enabled.
- Grey: The port has no active connection. PoE is enabled; link is disabled.
- Dark Grey: The port has no active connection. PoE is disabled; link is enabled.
- Dark purple: The port has no active connection. PoE and link are both disabled.
- Green: The port is up with an active connection. PoE is enabled.
- Dark Green: The port is up with an active connection. PoE is disabled.
- Blue: This port is configured as an uplink; this will override all other color statuses for a port.
- Yellow Outline: This port is mirrored with another.
- Blue Outline: This port is part of an aggregation.
Hovering your mouse cursor over an active port will indicate how many devices are within its forwarding table.
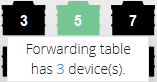 Figure 4: Forwarding table
Clicking the number of devices link will display all connected devices on that port. You can also click View all connected devices for this switch for a list of all connected devices on the switch.
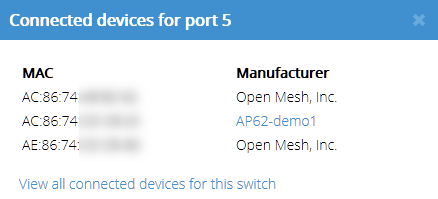
Figure 5: Connected devices for a port
Hardware and Software Information
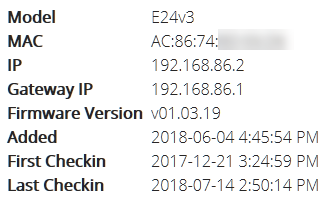
Figure 6: Hardware and Software Information
This list shows the following:
- Model: The model of the switch.
- MAC: The MAC address of the switch
- IP: The IP address of the switch
- Gateway IP: The IP address of the switch's gateway
- Added: A timestamp of when the switch was added to your network
- First Checkin: A timestamp of the switch's first checkin
- Last Checkin: A timestamp of the switch's last known checkin
Total PoE Usage
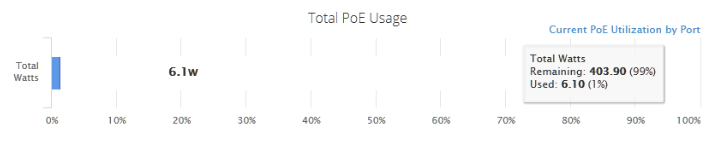
Figure 7: Total PoE Usage with Total Watts expanded
This bar graph displays the total, remaining, and used power (in watts) consumed by Power over Ethernet. Clicking Current PoE Utilization by Port will direct you to that respective graph on the Status page.
Total Traffic Utilization
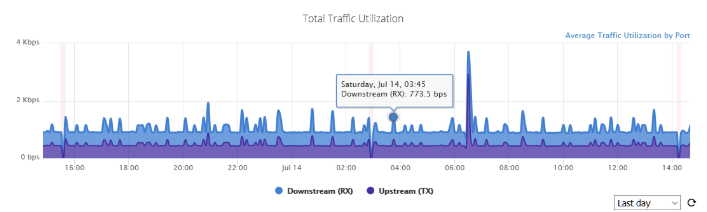
Figure 8: Total Traffic Utilization highlighting a specific RX point
This graph displays the total downstream (RX) and upstream (TX) traffic processed by your switch. You can hover your mouse on a specific point of time for either RX or TX to display additional information. The graph can display data for either the last 2 hours, last day, last week, or last month. Clicking Average Traffic Utilization By Port will direct you to that respective graph on the Status page.
Average Traffic Utilization By Port
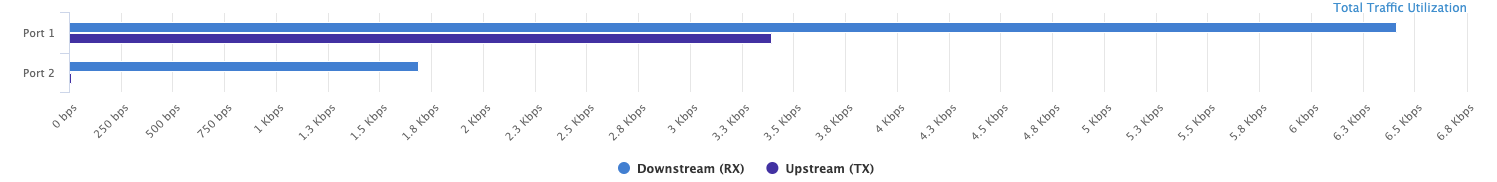
Figure 9: Average Traffic Utilization of all ports within the last day
This graph displays the average traffic (both RX and TX) utilization by port. You can hover your mouse cursor on a port's RX or TX bar to display additional information. The graph can display data for either all active ports or the most active port, within the last 2 hours, last day, last week, or last month. Clicking Total Traffic Utilization will direct you to that respective graph on the Status page.
Current PoE Utilization by Port
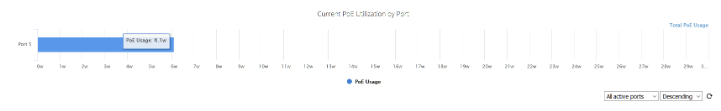
Figure 10: Current PoE Utilization by Port
This graph displays the current PoE utilization by each port in watts. You can hover your mouse cursor on a port's bar to display additional information. The graph can display data for either all active ports or the most active port, within the last 2 hours, last day, last week, or last month. Clicking Total PoE Usage will direct you to that respective graph on the Status page.


