Switches: Troubleshooting Tools
This article describes the Troubleshooting Tools page within the Datto Switches User Interface.
Environment 
- Datto Switches
Overview 
Datto Networking Switches provides a variety of troubleshooting tools to assess the status of your network and the devices within it.
Navigation 
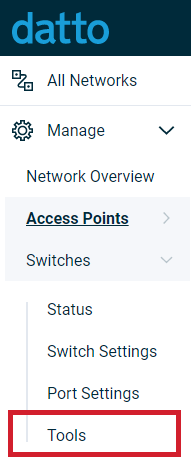
In the Navigation menu, click Switches, then select Tools from the expanded options.
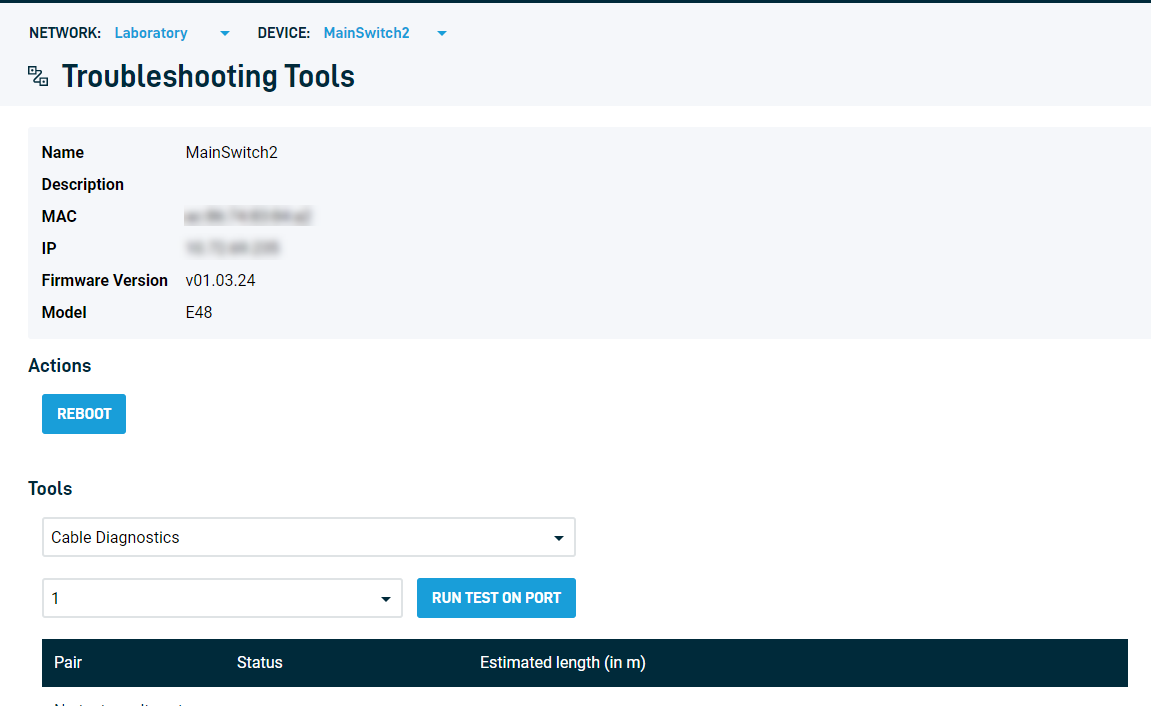
This will direct you to the Troubleshooting Tools page. The following information, troubleshooting tools, and actions are available:
Hardware Information 
The following information about your switch is presented in the troubleshooting page:

Figure 2: Hardware Information
- Name: This displays the name of your switch.
- Description: This displays the descriptor of your switch.
- Model: This displays the model of your switch.
- MAC: This displays the MAC address of your switch.
- IP: This displays the IP address of your switch.
- Firmware Version: This displays the firmware version your switch is running.
Reboot 
Click the Reboot button to reboot your switch. This is always present within the Troubleshooting Tools page.
Cable Diagnostics 
Cable Diagnostics will display the status of each pair present within the Ethernet cable that connects the switch to another node.
The cable diagnostics test will return inaccurate results if run on a live port that is actively passing traffic or PoE.
To run the tool, follow these steps:
1. Select Cable Diagnostics in the Tools drop-down menu.
2. Select the port on which you wish to run the test.
3. Click the Run test on port button.

Figure 4: Setting up Cable Diagonstics
The following information displays when the test is run:
- Pair: This displays the pair tested on within the Ethernet cable.
- Status: This displays the status of the pair.
- Estimated length: This displays the estimated length of the pair in meters. This may be inaccurate when 'OK' is displayed.
LLDP Neighbors 
LLDP Neighbors will display information about all devices broadcasting information over LLDP.
To show LLDP Neighbors, select it from the Tool drop-down menu.

Figure 6: Selecting LLDP Neighbors
The following LLDP data will display:
- Port: Displays the active port the device is using.
- Chassis ID Subtype: Displays the subtype of the Chassis ID (typically the MAC address).
- Chassis ID: Displays the Chassis ID (typically the MAC address).
- Port ID Subtype: Displays the Port ID Subtype of the device.
- System Name: Displays the user-configured name of the device.
- Advertised Capabilities: Displays all speeds the device's node can transmit data over, and whether it is half or full duplex.
Ping 
Ping will test the reachability of a host or IP address.
To run the Ping tool, follow these steps:
1. Select the Ping tool from the Tool dropdown.
2. Enter an IP address or hostname.
3. Click the Ping button.

Figure 9: An example Ping test successfully reaching an IP address
Traceroute 
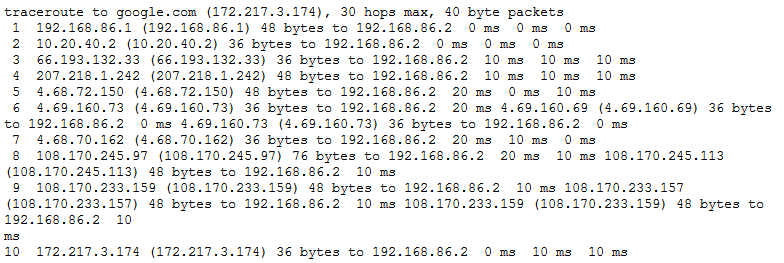
Traceroute will display the full path to an IP address or a hostname, and the number hops taken to reach it.
To run the Traceroute tool, follow these steps:
1. Select the Traceroute tool from the Tool dropdown.
2. Enter an IP address or hostname.
3. Click the Traceroute button.

Figure 10: Setting up Traceroute

Figure 11: An example Traceroute displaying all hops to Google.com
Connected Devices 
Connected Devices displays all devices connecting to your switch.
To display connected devices, select Connected Devices from the Tool dropdown.

Figure 12: Selecting Connected devices
When displaying connected devices, the page will show the connecting port, the MAC address of the device, and its manufacturer, as seen in Figure 13.


